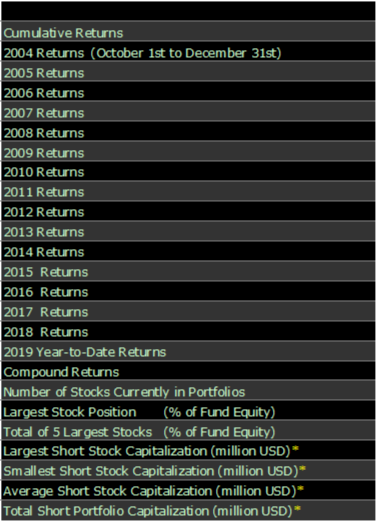
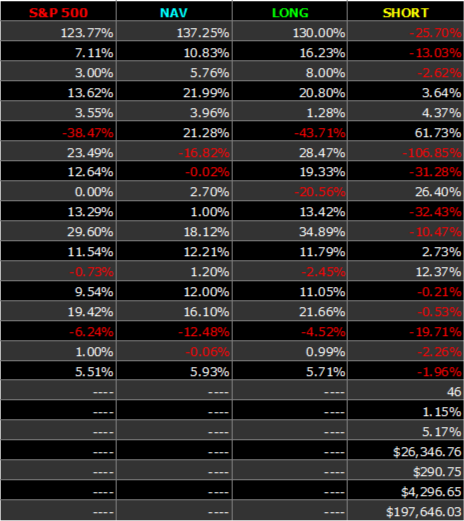
Performance of the Hedge Synergy NAV, Long Portfolio, Short Portfolio and S&P 500
The virtual long/short equity Hedge Synergy Fund was started on October 1, 2004. The web site was launched April 23, 2005 and is updated weekly (see Barron's classified ads 4/25/05 page MW6). The above chart shows the returns of the virtual Hedge Synergy Fund NAV (net returns after deducting Performance/Asset Fee), long portfolio, short portfolio and the S&P 500. For an explanation of my methodology please see Hedge Strategy.
|
2019 Q3 — Quarterly Hedge Fund Performance - Friday 06/28 to Friday 08/02
The above chart shows the performance of the virtual Hedge Synergy Fund NAV (net returns after deducting Performance/Asset Fee), Hedge Synergy Fund Gross returns, Long Portfolio, Short Portfolio and the S&P 500 for the third quarter of 2019. On June 28, the short stock portfolio contained 32 stocks so the short portfolio was 32% of the fund equity and the long stock portfolio was 100% of fund equity. This made the funds net exposure 68% and the gross exposure 132%. On July 26, 2019 (the white vertical line) the short stock portfolio contained 35 stocks so the short portfolio was 35% of the fund equity and the long stock portfolio was 100% of fund equity. This made the funds net exposure 65% and the gross exposure 135%. On August 30 2019 (the red vertical line) the short stock portfolio contained 43 stocks so the short portfolio was 43% of the fund equity and the long stock portfolio was 100% of fund equity. This made the funds net exposure 57% and the gross exposure 143%.
|
|